- Finance
- Automation
- Data
- BI
DAN
A payment systems monitoring application, designed to automate and structure part of the off-site oversight of CEMAC payment systems and means of payment.
Project connected to an internship at the BEAC. The version shown here is a public demo: data, risk mapping, report templates and logos are synthetic. No real transaction, participant or institutional data is included.
- Status
- Completed prototype
- Role
- Design and development
- Period
- 2026 · BEAC internship and dissertation
- Links
- Source code
01Context
Developed during my internship at the BEAC's Payment Systems and Means of Payment Department (DSMP), from June to August 2026, and for my dissertation.
Payment systems oversight (large-value settlement, clearing, interbank messaging, network infrastructure) relies on incident reports sent every month by many participants across several CEMAC countries.
02Problem
These reports arrive as heterogeneous Excel files. Consolidating them by hand in spreadsheets is slow and inconsistent from one month to the next, while the team needs to decide quickly where attention is required.
03Objective
- Ingest heterogeneous reporting files with minimal manual preparation.
- Map each reported event to a risk category and level, then compute a consolidated, explainable severity score.
- Compare countries and systems, and track trends over time.
- Generate consolidated reports without copy-paste.
04Data
Monthly Excel reporting forms (.xlsx, .xls), one per participant, country and system. Country, month and year are inferred from the folder structure; the payment system is recognised from the events' reference codes.
A risk mapping links each event type to a risk category and level.
In the public version all data is fictitious: 3 countries, 2 banks and 4 systems, generated by a script in the repository.
05Methodology
A transparent score rather than an opaque model: an event's severity combines an occurrence weight (with logarithmic smoothing) and the weight of its risk level. Combined risks are split across their categories, and thresholds (critical, high, medium, low) remain configurable.
Business logic is kept separate from the interface so it can be unit-tested. A pytest suite runs in continuous integration on every change.
06From problem to decision
The processing steps, from the business question to the decision.
- 01
Business problem
Every month, incident reports arrive from many participants and several countries. The team needs to know quickly where attention is required.
- 02
Data
Excel reporting forms, organised by country, month and institution, and a mapping that links each event type to a risk category and level.
- 03
Processing
Import of a file or a whole folder. Country and period are inferred from the folders, the system is recognised from the reference codes, and inconsistent files are flagged.
- 04
Control logic
Each occurred event is mapped to its risk. Its severity combines its smoothed frequency and the weight of its risk level.
- 05
Indicators
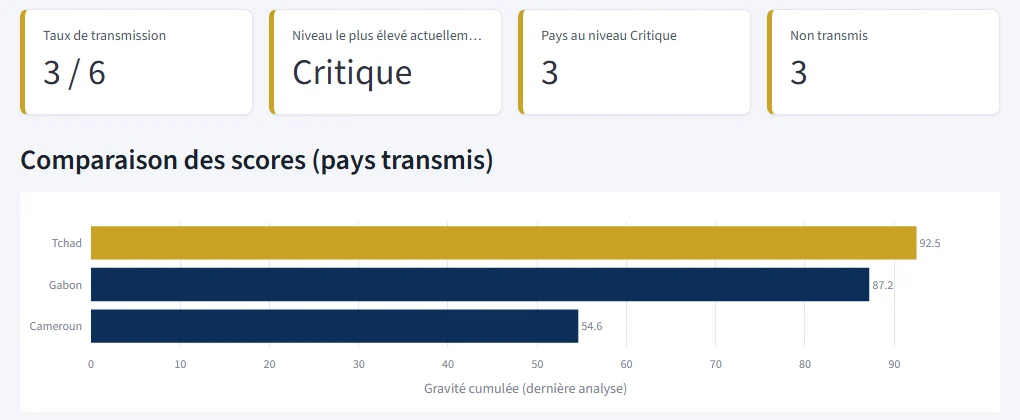
Consolidated score per country, breakdown by system, number of occurred incidents, reporting transmission rate and risk level against configurable thresholds.
- 06
Reporting
Consolidated incident report and monthly activity report, generated from Word templates and exportable to PDF.
- 07
Decision
Plain-language interpretation, probable causes, dominant risks, recommendations and a proposed action plan to steer oversight.
07Solution
- Import of single files or a whole folder, with tolerant matching (case, accents, abbreviations) and warnings on inconsistent files.
- Dashboard: consolidated score, breakdown by system and plain-language interpretation.
- Incident analysis: occurred incidents, probable causes, dominant risks, recommendations and a proposed action plan.
- Multi-country view and analysis history.
- Word report generation from templates (consolidated incident report, monthly activity report), with PDF export.
- Optional assistant built on a language model running locally (Ollama).
08Preview

09Technologies
- Python 3.11
- Streamlit
- pandas
- NumPy
- openpyxl
- docxtpl
- python-docx
- Plotly
- Matplotlib
- ReportLab
- pytest
- GitHub Actions
- Ollama
10Results
A completed prototype covering the whole chain, from importing the reports to ready-to-share reports.
A public, documented and tested demo version that can be shown without exposing any internal data.
11Limits
- The score weights are heuristic and have not been validated against real outcomes.
- The risk mapping and templates provided are illustrative.
- French-only interface, for a single local user, without authentication.
- A PDF faithful to the templates requires Microsoft Word or LibreOffice; otherwise a simplified PDF is produced.